Customer Analysis Dashboard
I created this dashboard to analyze customer demographics and spending patterns using sample data. It's a great way to visualize customer segments and explore relationships between different customer attributes.
What's in the Dashboard
The dashboard breaks down our customer data into several key views:
-
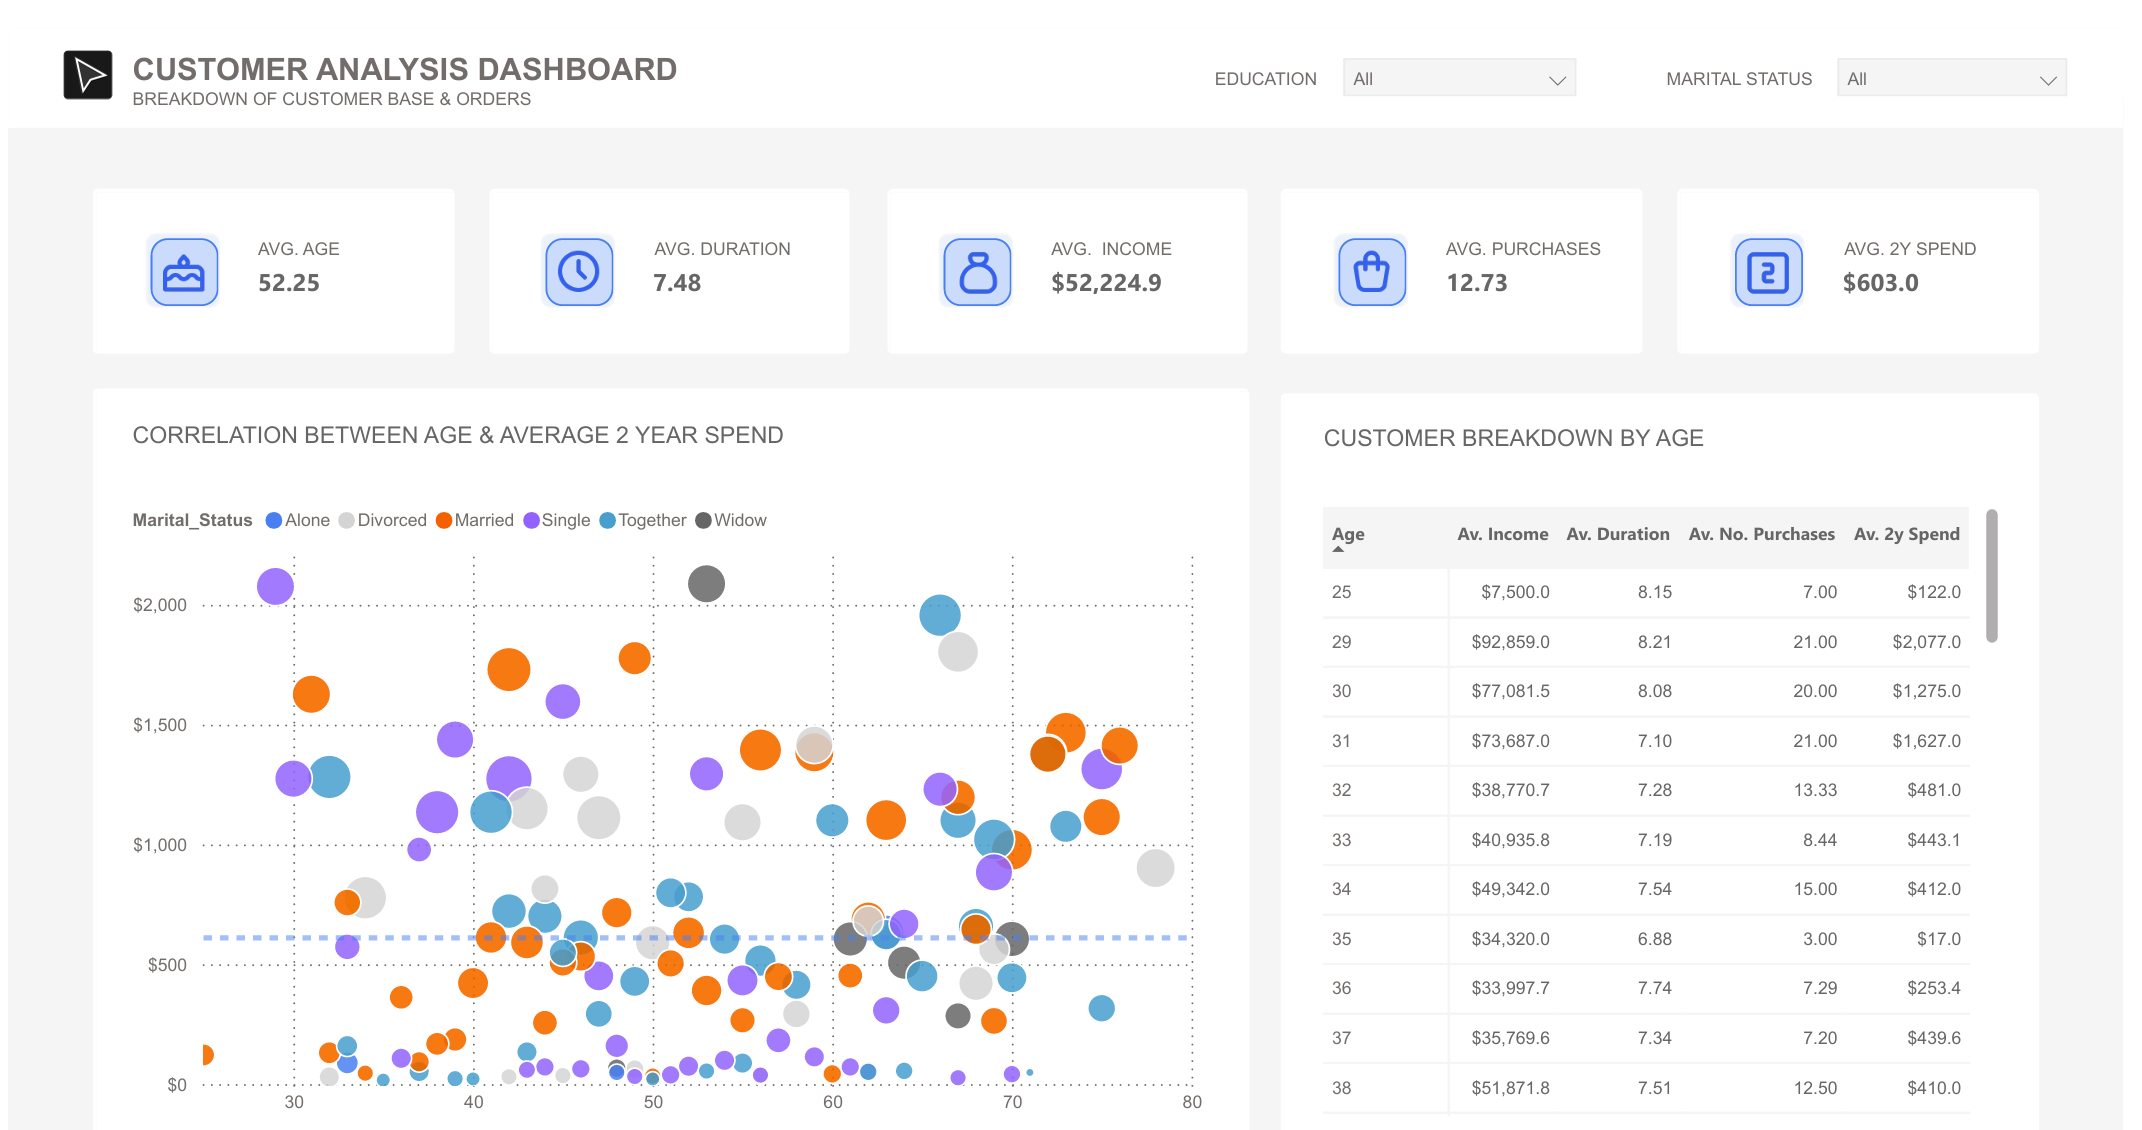
Quick Stats: At the top, you'll find the key metrics - average customer age (52.25 years), average relationship duration (7.48 years), average income ($52,224.90), average number of purchases (12.73), and average 2-year spend ($603.00).
-
Spending Patterns: The main scatter plot shows the correlation between customer age and their 2-year spending, with different colors representing marital status. It's interesting to see how spending varies across different life stages.
-
Customer Segments: A detailed breakdown table showing customer metrics by age, including average income, duration of relationship, number of purchases, and spending.
-
Filtering Options: Added some handy filters for education and marital status at the top, so you can drill down into specific customer segments.
Just for Fun
While I'm working with dummy data here, this kind of visualization really helps spot patterns in customer behavior. You can quickly see things like which age groups tend to spend more, or how marital status might relate to purchasing patterns. Pretty neat way to make sense of customer data at a glance!